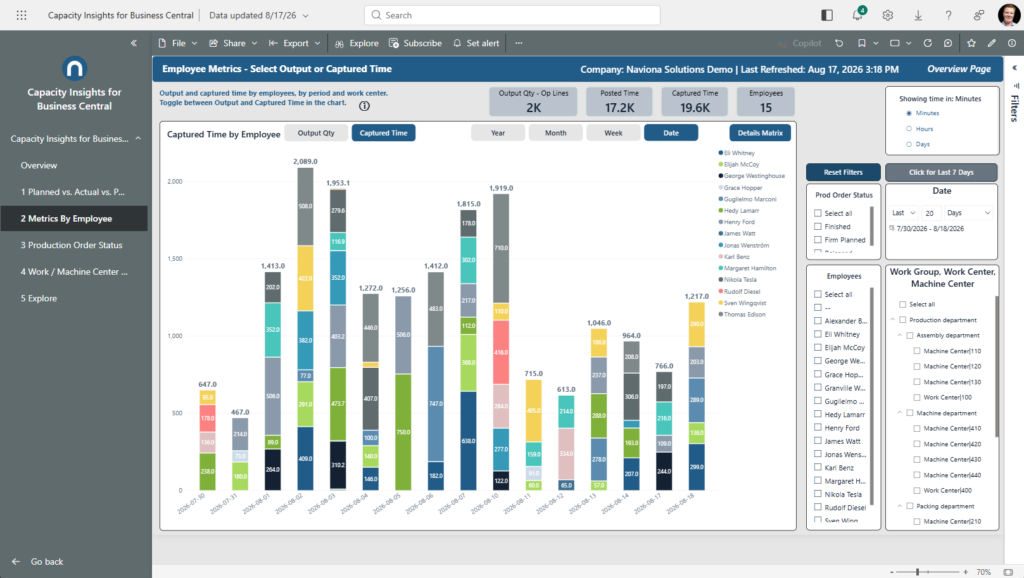
Output and captured time by employee, by period and work center. Toggle between Output and Time Captured above the chart.
What it shows
One view of each person’s contribution, with a toggle. Output shows how much each person produced; Time Captured shows how much time they logged. Output is credited at the operation each person ran, so build and machining work goes to the operator who did it, not just whoever ran the final routing step.
Captured time is the live start/stop time from the Mobile Manufacturing Solution. Every minute here should also appear as Posted on Report 1; a gap means time was captured but not yet posted. Read the rate columns in the Details Matrix as a productivity indicator, not a speed leaderboard — they reflect each person’s mix of operations (setup-heavy work runs a lower rate than long production runs).
Use it to
- Measure each person’s output for a period, credited to the operation they actually ran.
- See how much time each person logged, by work center.
- Compare productivity on the rate columns in the Details Matrix.
- Confirm captured time is flowing through to posting.
How to use the page
- Select Output or Time Captured to toggle the metric.
- Click the Details Matrix button to see the data in tabular form.
- Pick Year / Month / Week Beginning / Date to group by different time buckets.
- Use the slicers on the right to narrow the chart and the Details Matrix.
Note. Output is counted per operation, so the grand total reflects operation throughput, not a finished-item quantity.