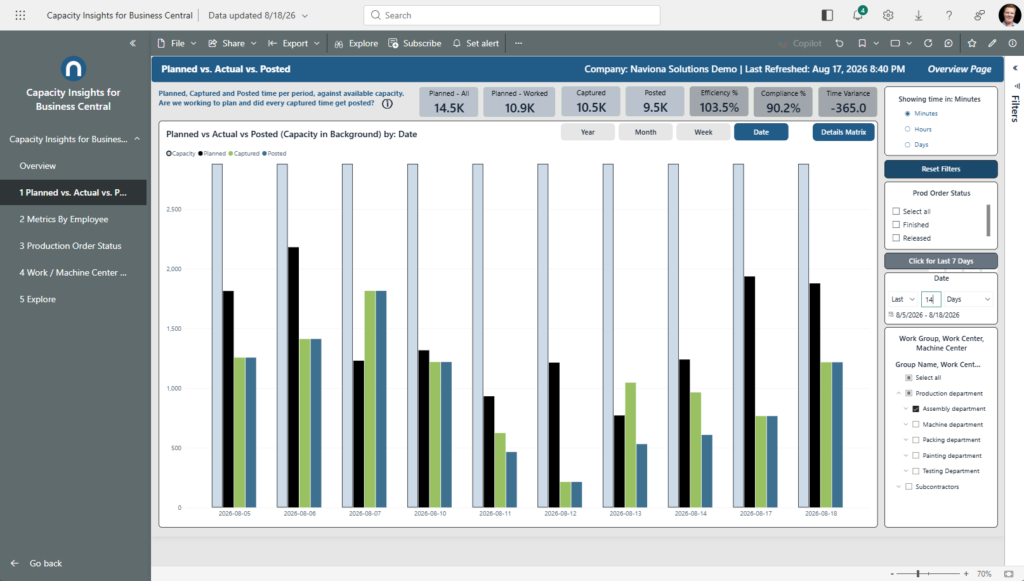
Planned, captured, and posted time per period, against available capacity. Are we working to plan — and did every captured minute get posted?
What it shows
Three bars per period sit inside a capacity band. Planned is the scheduled capacity requirement from the production plan; Captured is the actual start/stop time from the Mobile Manufacturing Solution; Posted is the time recorded on the capacity ledger. The shaded band behind the bars is Available Capacity — the time the center could work, from the work center calendar.
There are two reads. Captured against Planned tells you whether the floor is running to plan. Captured against Posted exposes time that was captured but not yet posted — the reconciliation gap. The KPI cards summarize this: Efficiency % (planned effort ÷ actual effort on the operations worked), Compliance % (Posted ÷ Captured), and Time Variance (Captured − Planned on worked operations).
Use it to
- See whether the floor is working to plan — Captured against Planned for any period or center.
- Catch time captured but not yet posted — watch the Captured-to-Posted gap and the Compliance % KPI.
- Gauge how hard a center is running — the bars against the capacity band.
- Compare efficiency across periods or centers on the Efficiency % and Time Variance KPIs.
How to use the page
- Click a bar to cross-filter the page; click the Details Matrix button to see the data in tabular form.
- Pick Year / Month / Week Beginning / Date to group by different time buckets.
- Use the slicers on the right to narrow by work center and date.
Note. Each series is dated by its own activity — Planned by plan date, Captured by capture date, Posted by posting date. A very narrow date window can show one series without its partners; widen the range to compare like-for-like.